- Research
- Open access
- Published:
Evaluation of stability of swipe gesture authentication across usage scenarios of mobile device
EURASIP Journal on Information Security volume 2020, Article number: 4 (2020)
Abstract
Background
User interaction with a mobile device predominantly consists of touch motions, otherwise known as swipe gestures, which are used as a behavioural biometric modality to verify the identity of a user. Literature reveals promising verification accuracy rates for swipe gesture authentication. Most of the existing studies have considered constrained environment in their experimental set-up. However, real-life usage of a mobile device consists of several unconstrained scenarios as well. Thus, our work aims to evaluate the stability of swipe gesture authentication across various usage scenarios of a mobile device.
Methods
The evaluations were performed using state-of-the-art touch-based classification algorithms—support vector machine (SVM), k-nearest neighbour (kNN) and naive Bayes—to evaluate the robustness of swipe gestures across device usage scenarios. To simulate real-life behaviour, multiple usage scenarios covering stationary and dynamic modes are considered for the analysis. Additionally, we focused on analysing the stability of verification accuracy for time-separated swipes by performing intra-session (acquired on the same day) and inter-session (swipes acquired a week later) comparisons. Finally, we assessed the consistency of individual features for horizontal and vertical swipes using a statistical method.
Results
Performance evaluation results indicate impact of body movement and environment (indoor and outdoor) on the user verification accuracy. The results reveal that for a static user scenario, the average equal error rate is 1%, and it rises significantly for the scenarios involving any body movement—caused either by user or the environment. The performance evaluation for time-separated swipes showed better verification accuracy rate for swipes acquired on the same day compared to swipes separated by a week. Finally, assessment on feature consistency reveal a set of consistent features such as maximum slope, standard deviation and mean velocity of second half of stroke for both horizontal and vertical swipes.
Conclusions
The performance evaluation of swipe-based authentication shows variation in verification accuracy across different device usage scenarios. The obtained results challenge the adoption of swipe-based authentication on mobile devices. We have suggested ways to further achieve stability through specific template selection strategies. Additionally, our evaluation has established that at least 6 swipes are needed in enrolment to achieve acceptable accuracy. Also, our results conclude that features such as maximum slope and standard deviation are the most consistent features across scenarios.
1 Introduction
Biometric applications on mobile devices, also known as ‘mobile biometrics’, have emerged as a result of consumer demand for convenient security. The large-scale adoption of Apple’s TouchID and FaceID demonstrates that users are willing to adopt alternative authentication methodologies to typing a password or entering a PIN. However, attack models to forge the physiological biometrics such as face, finger and iris have also developed vigorously [1–3]. Hence, in order to augment the security, behavioural biometrics, with secure and robust authentication techniques, are rising as an alternative option. These are of particular interest in areas such as mobile banking and payments, and mobile biometrics are gradually gaining popularity.
Behavioural biometrics make use of the behavioural traits of a user for authentication. One such mechanism is to make use of touch-dynamics exhibited by a user on a mobile device to create a unique behaviour model and use it for authentication purposes. The user’s touch gestures on the mobile devices consist of horizontal and vertical swipes. Touch sensors embedded within the screen can extract features such as time stamp, touch coordinates (X-coordinate, Y-coordinate), finger pressure and finger touch area. These features are utilised to model the user’s touch behaviour on the touch screen.
Behavioural biometric modalities such as keystroke dynamics and swipes, are used in the context of continuous authentication [4–6]. Unlike a one-time password method (PIN, password), continuous authentication techniques non-intrusively verify throughout a session without interrupting the user’s actions on the device. Despite its promising advantages about convenience, continuous authentication on mobile devices still has open challenges. In context of swipe gesture authentication, one of the key challenges is to ascertain that it can be performed with high verification accuracy across usage scenarios of a mobile device. The compactness and portability of mobile devices provide flexibility for the user to operate them across diverse scenarios both indoor and outdoor, and, accordingly therefore, the authentication performance is expected to stay consistent across these scenarios. Aiming to analyse this factor, our study has been conducted to evaluate stability of the verification performance of swipe gestures across different usage scenarios. Due to availability of limited datasets with multiple usage scenarios, a data collection was conducted. In order to simulate real-life like usage scenarios, the data acquisition sessions were designed where users were asked to perform the exercise such as interacting with the phone in constrained (laboratory set-up) and in the wild. The constrained scenario consisted of the user performing the exercise while seated on a chair and the unconstrained scenario consisted of the user performing the tasks while walking outdoors, while walking at a fixed pace on a treadmill and while travelling on a bus. The performance evaluations were conducted using three classification algorithms. Based on these evaluations, this paper contributes on three areas:
Evaluation of verification performance using swipe gestures under different usage scenarios of mobile device
Evaluation of time persistence by comparing intra-session and inter-session verification accuracy
Evaluation of consistent features across different usage scenarios
2 Related work
A number of studies have explored touch-dynamics based behavioural biometrics for continuous authentication (listed in Table 1). The majority of touch data used for analysis comprise of data collected in a laboratory set-up. Frank et al. [6] experimented with authenticating users based on their raw touchscreen logs. Their experiment involved 41 participants with four different mobile phone models and collected data across two sessions (separated by a week). They used support vector machine (SVM) and k-nearest neighbours (kNN) classifiers which achieved “a median equal error rate of 0% for intra session authentication and below 4% when the authentication test was carried out one week after the enrolment phase”. Although the results reveal promising verification rates, their experimental protocol for data collection does not describe the usage scenarios (such as seated or standing) while undertaking the experiment.
Multiple studies have utilised the touch gestures acquired from different user interface (UI) elements and varied application contexts of the mobile device. A study conducted by Saravanan et al. [8] evaluated different UI elements such as radio buttons, check boxes and sliders to authenticate a user. Their study consisted of 20 participants and the data collection phase involved the users to fill digital form on a mobile device using different UI elements. Based on SVM classifier, they achieved an authentication accuracy of 97.9% on mobile devices and 96.79% on tablets. On the other hand, Feng at al. [9] utilised a combination of contextual app information with touch gesture features in their authentication model. They collected touch gestures such as swipe, click, zoom-in and zoom-out in an unconstrained environment. Their model used one nearest neighbour with DTW (dynamic time warping) classification algorithm and achieved 90% accuracy in real-life scenarios. Similarly, Wang et al. [10] utilised the touch gestures generated by real-world app usage. They analysed users touch gestures along with the app context for recognition. Their model used SVM classifier with RBF (radial basis function) kernel and achieved an AUC (area under the curve) of 80–90%. These studies captured touch data under variety of app contexts and UI elements; however, none of them assessed scenario-based performance variation.
There are limited studies that have considered a variety of usage scenarios of the mobile device. The experiment conducted by Bo et al. [7] explored the touch-dynamics when a user is stationary (static) and in motion (walking). They intended to capture the tiny perturbation of a mobile device when a user touches it and utilised those features for authentication. For the walking scenario, they reported that after 2 walking steps, the false acceptance rate (FAR) reduced to 0%, and after 4 walking steps, the false reject rate (FRR) was 18%. This indicates that walking has an impact on the verification performance. Additionally, studies such as [8] and [9] also have indicated a need to further investigate the influence of external contexts such as sitting and walking in their future work section. Based on our observation and assessment of the referenced studies, we decided to evaluate this factor in detail.
3 Methodology
This section describes the description of data used for the experiment, experimental configuration and procedure followed for performing user verification: pre-processing, feature extraction, classification, enrolment and verification phases.
3.1 Data description
There are a number of publicly available swipe gesture based datasets—[11–15]. However, none of these datasets contain swipe data captured under different usage scenarios of a mobile device. For instance, the dataset by [11] contains 2000 participants; however, for the data collection phase, they released an app on the Google App store to be downloaded and used. They did not report on the usage scenario. Our aim was to evaluate both horizontal and vertical swipe gestures captured in at least two sessions that were separated by at least a week. The database of Antal et al. [15] consisted only of horizontal swipes after session 2, 3 and 4, and [14] had two sessions separated by at least one day apart; therefore, we could not utilise these datasets.
For the evaluation, a multi-modal behavioural biometric dataset [16] consisting of 50 participants was used. This dataset is not publicly available. This dataset consists of touch data captured across a range of modalities: swipe gestures, signature (finger and stylus), keystroke, accelerometer and gyroscope data from a Samsung Galaxy Note 5 (an Android-based device). The participants (60% male and 40% female) were familiar with touch screen-enabled mobile devices. However, in order to avoid bias for the Android device and iOS device users, the iOS device users were given extra time before the experiment to familiarise with the Android device. The experiment was divided into two sessions separated by a week. An application in form of a general knowledge quiz was developed for data collection. The app involved on-screen image navigation (as shown in Fig. 1), numerical and alphabetical typing and signature production using finger and stylus. The context of user interface on the mobile phone was different for horizontal and vertical swipes. The experiment designed for obtaining horizontal swipes was in the form of swiping through images from the image gallery predominantly generating swipes of direction right-to-left. For vertical swipes, the user had to scroll through the application vertically, generating down-to-up direction swipes. For horizontal swipes, the entire content of the screen changed with one single swipe, whereas for vertical swipes, the vertical scrolling property was used that did not change the entire content of the screen with one single swipe action. Throughout data collection, the mobile phone’s orientation was fixed to portrait mode. Data was collected under two different environments—indoors and outdoors.

Usage Scenarios. a Static. b Dynamic —walking on a treadmill. c Dynamic—seated on a bus. d User Interface of the Touchlogger App
The usage scenarios considered for the experiment were categorised into static and dynamic (as shown in Fig. 2). During static scenario, users performed the experiment while seated on a chair, holding the phone in their hand. Dynamic scenarios were further classified into three categories: (a) the user is moving and the environment is static (walking outdoors), (b) the user is static and the environment is moving (the user is seated on a bus) and (c) the user as well as the environment is moving (the user walking on a treadmill as shown in Fig. 1). During the experiment, users were also asked to indicate their previous experience of using the mobile device in simulated scenarios of the experiment. Only 18% of the users indicated having previous experience with using a mobile device on a treadmill.

Scenario categorisation of the data collection
After acquiring the swipe-gesture data, the verification model was developed. It consisted of pre-processing, feature extraction and classification phases that are described in the next sections.
3.2 Pre-processing
The raw touch data generated a list of data points with parameters: time-stamp, X-coordinate value, Y-coordinate value, touch action, finger pressure and finger touch area. Touch action of a swipe consisted of ACTION_DOWN, ACTION_MOVE and ACTION_UP (in the same order for every swipe). Pre-processing was performed separately for the horizontal and vertical swipes. The pre-processing phase was focused on identifying outliers in terms of less number of data points and invalid swipe input. Swipes containing less than three data points were discarded. We observed that mostly the button press generated these short swipes. We also identified swipes with no ACTION_DOWN but having the other touch actions, that is, ACTION_MOVE and ACTION_UP. We believe that it is caused due to hardware limitations. A possible explanation could be that such vertical swipes were performed very fast and close to each other, thus, leaving no time gap for the sensor to capture ACTION_DOWN. Such swipes were identified and removed.
3.3 Feature extraction
For every swipe stroke, a set of 28 features were computed, which are listed in Table 2. The features taken into consideration for this analysis were global features, calculated for the entire swipe, such as average velocity and total stroke time. The features ‘Start X Position’ and ‘Start Y Position’ refer to the corresponding X and Y coordinates of ACTION_DOWN action of the swipe. In similar manner, the X and Y coordinates of ACTION_UP were assigned as ‘End X’ and ‘End Y’ features respectively. A single swipe stroke consisted of multiple ACTION_MOVEs, the distance travelled from one ACTION_MOVE to the next were calculated for the X and Y positions as Delta X and Delta Y. ‘Average Delta X Position’ and ‘Average Delta Y Position’ were calculated by obtaining the average of the calculated Delta X and Delta Y. The ‘width’ of the swipe was calculated as the Euclidean distance from its first touch point (ACTION_DOWN) to last touch point (ACTION_UP). The slope was calculated as the change in ‘Y’ position with respect to ‘X’ calculated for each data point of a swipe. The maximum and minimum slope values obtained from swipe were assigned as ‘maximum slope’ and ‘minimum slope’. First and second derivatives of the distance (Delta X and Delta Y) were calculated as velocity and acceleration. From these values, ‘average velocity’ and ‘average acceleration’ were obtained. ‘Attack angle’ was calculated as gradient between the first and the second touch data point. Similarly, ‘leaving angle’ was calculated as gradient of the second last and the last data point. The touch finger size was captured at every touch action point, and ‘average finger size’ was calculated. These set of global features calculated for every single swipe were fed into the classifiers as an input.
3.4 Classifiers
Three discriminative classifiers—support vector machine (SVM), k-nearest neighbour (kNN) and naive Bayes—have been used for the analysis. Python’s Scikit-learn library has been utilised for implementation. Our decision to use these three classifiers has been motivated by multiple reasons. Firstly, we aimed at showing the impact of usage scenarios of a mobile device using the most used and already proven classifiers. As shown in the literature (Table 1), SVM classifier has been proven to be widely effective in multiple studies using swipe-based authentication ([6, 17, 18]). Secondly, SVM is a powerful classifier for supervised binary classification problem such as ours, where the verification model has to accurately classify the genuine and imposter class. SVM algorithm finds the optimal hyperplane in the N-dimensional feature space that can distinctly classify the data. Additionally, instead of a one-class SVM classifier that utilises only positive samples (which significantly saves space and improves speed), we used a two-class classifier as it was the most appropriate for the verification problem such as ours. We also considered a ‘zero-effort’ attack model where one randomly chosen user from the database is considered as an attacker. This attack scenario can be interpreted as an individual attacker getting hold of a mobile device and trying to gain access to app services by forging the genuine user samples. A SVM classifier with a linear kernel has been used with multiple C (regularisation parameter) values. The C value is a parameter that controls the trade-off between the decision boundary and the misclassification rate. In order to identify the optimal parameters for the classifier, parameter tuning using a grid search method was performed. This was done using increasing sequences of C values (0.01, 1, 10, 100, 1000). This parameter tuning was performed for every user model using the baseline scenario (sitting) as the enrolment samples always belonged to the ‘Sitting’ scenario. Based on this search, the best value of C was assigned as 1 for the entire evaluation. A radial basis function (RBF) kernel was also utilised for evaluation; however, as the obtained accuracy rates were not in acceptable range, we did not report it in this article. A possible reason for the worse performance could be that the data is linearly separable and using a RBF would cause a forced classification of data in the mapped hyperplane.
The reasons for choosing k-NN classifier are its fast computation and robustness characteristics. This algorithm is based on the concept that similar features exist in close proximity. Therefore, every incoming swipe stroke is first located in the feature space with respect to the training swipes, and based on the majority of class labels of the k neighbouring training samples, a class is assigned to the incoming stroke. In order to select the k value, multiple runs (minimum of five) with different k values with randomly selected training and validation sets have been performed for every user verification model for all scenarios. Based on the outcome of this analysis, the final k value was picked as five as it gave the lowest classification/estimation error across different validation sets (depicted in Fig. 3).

Average EER for horizontal swipes with different K values
The third classifier used was naive Bayes which “assigns the most likely class to a given example described by its feature vector” [19]. Naive Bayes was chosen as it is a simple probabilistic model used for classification purposes.
3.5 Enrolment and verification
During data collection, swipe gestures were collected and the verification process was performed off-device. We based our analysis on the hypothesis that there is only one primary user (owner) of a mobile device; therefore, the verification process was designed to verify templates of the primary user.
Regarding the user selection, the user model was enrolled using horizontal and vertical swipes of one genuine and one imposter user. The imposter user was chosen from the dataset based on random forgery method. All the imposter samples belonged to that chosen user. The same imposter user was used in the verification phase as well.
Regarding the process involved in the enrolment and verification phase, the genuine as well as imposter user swipe samples were split with a proportion of 25% as enrolment samples and 75% as verification samples. From the enrolment sample set, only a few swipe samples were randomly chosen for enrolment. To avoid bias, an equal number of genuine and imposter samples were chosen for training the user model (for example, if two swipes were chosen from the genuine class, then two samples from the imposter class were chosen for enrolment). The number of swipe samples chosen for enrolment were different based on the research question considered for the analysis (detailed in the subsection enrolment). The swipe samples used in enrolment were not used in the verification phase. The description of the enrolment and verification phases (shown in Fig. 4) is provided below.
Enrolment Swipe gesture samples acquired from both classes—the genuine and the imposter—were enrolled. Horizontal and vertical swipes were enrolled separately. The enrolment strategy employed to carry out analysis for each of the research questions are outlined below.
In order to find an optimum number of training samples, the model was enrolled with 2, 4, 6, 8, 10 and 12 randomly chosen swipe samples belonging to the genuine and the imposter user from the baseline scenario (sitting) from session 1. The results obtained using a range of enrolment samples are explained in Section 4.1.
Fig. 4 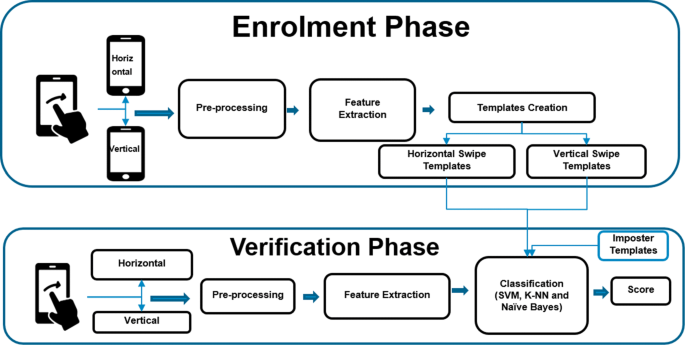
Design of the user verification architecture
For intra-session evaluations (comparison between scenarios within each session), the user verification model was enrolled with the swipe gestures captured in the baseline scenario (sitting) and was verified against the swipe samples captured on different scenarios (such as treadmill and walking). The number of swipe samples enrolled were 2, 4, 6, 8, 10 and 12.
For inter-session evaluations (between session 1 and session 2), swipe samples acquired in session 1 were enrolled and verified against swipe samples from session 2 belonging to the same usage scenario. The number of swipe samples enrolled were 2, 4, 6, and 10.
Verification: For verification, the imposter samples belonged to the same imposter user used in the enrolment phase. The number of swipes used in the verification phase were around 50. All of these swipes belonged to the pool of 75% swipe samples earmarked for verification at the beginning.
During the verification process, the incoming swipe stroke was first classified as a horizontal or a vertical swipe. Following this, pre-processing and feature extraction steps were performed. Based on the swipe category, a user template (horizontal or vertical) was chosen. In the matching phase, probability similarity scores were generated by comparing it to the identified template class. This process was carried out for swipes from genuine and imposter users. Based on the generated scores, false acceptance (FAR) and false rejection rates (FRR) were calculated for different thresholds. Further, the equal error rate (EER) for both types of swipes, horizontal and vertical, were obtained.

4 Results
The performance evaluations were carried out for four different purposes : (a) to analyse the minimum number of swipes required in enrolment to accurately verify a user, (b) to analyse stability of swipe gestures across different usage scenarios, (c) to analyse stability of swipe verification over time and (d) to evaluate stable features across usage scenarios.
4.1 Analysis of minimum number of swipes required in enrolment to verify accurately
In order to investigate this factor, the user model was enrolled with different number of swipe samples during the enrolment phase, and remaining swipe samples were used for verification. It was expected that the verification accuracy would improve with an increase in number of enrolled swipes.
Figure 5 shows an average EER attained from the behaviour model of 50 users using different enrolment samples for horizontal and vertical swipes separately. It can be observed that with an increase in number of enrolled swipes, the EER becomes significantly low. The trend of decrease in EER rate with increased enrolment samples can be seen across different usage scenarios and classification algorithms. For example, using the SVM classifier, with 12 swipes in enrolment, the average EER attained is 1% for horizontal and 2% for vertical swipes. In going from four enrolled swipe strokes to six swipe samples in the enrolment, the EER value drop from 20 to 2% for the horizontal and 19 to 5% for the vertical swipes. The inter-session analysis (Fig. 6) also reveal a similar trend of decrease in EER rate with increased enrolment samples. According to the results acquired, it can be concluded that a minimum of 6 swipes are required to attain an acceptable verification accuracy.

Intra-session comparison (session 1) on the number of swipes in enrolment using SVM, kNN and naive Bayes

Performances in inter-session analysis using SVM
4.2 Performance analysis across different usage scenarios (intra-session analysis)
The intra-session analysis was performed on swipe gestures captured on the same day but using different usage scenarios. The results were attained individually for sessions 1 and 2. For this analysis, a number of comparison strategies with respect to enrolment and verification were implemented as detailed in Table 3.
For session 1, the user model was trained with swipe samples captured during the sitting scenario, and the verification swipe samples were taken from the sitting, treadmill and walking scenarios (captured on the same day during session 1). For session 2, the user model was enrolled with data from the sitting scenario and verified against the sitting, walking and the bus scenario. The results of individual comparisons for session 1 and session 2 using linear SVM classifier, k-NN and naive Bayes are given in Table 4. It can be observed that the SVM algorithm produced lowest EERs, followed by kNN and naive Bayes algorithms for all the scenarios. It can also be seen that naive Bayes shows the worst performance with EERs ranging from 33% and above even for the Sitting versus Sitting scenario comparison. The important factor to notice is that using SVM, the static scenario Sitting vs Sitting (having no body movement) in session 1 showed an EER of 1% and 2% for horizontal and vertical swipes, respectively. On the contrary, the EERs obtained for the dynamic scenarios Sitting vs Treadmill, Sitting vs Walking (sessions 1 and 2) and Sitting vs Bus rise significantly up to 23%, 31%, 27% and 30% respectively for horizontal swipes and 28%, 27%, 23% and 26% for the vertical swipes. A similar trend of increased EERs can be seen across kNN and naive Bayes for scenarios involving any body movement, caused either by users or environmental factors. The Sitting vs Bus and Sitting vs Walking scenarios acquired similar EERs. Using kNN, EERs acquired for horizontal swipes were 33% and 34%, using SVM, it was 27% and 30% and using naive Bayes 50% and 44% for the Sitting vs walking and Sitting vs Bus scenarios respectively.
Further, in order to verify that above results were not just a chance occurrence, two-tailed statistical significance tests were conducted. The purpose of performing these tests was to evaluate the hypothesis that acquired average EERs for static and dynamic scenarios are different. The null hypothesis and alternative hypothesis were considered for each of these intra-session comparisons. The alternative hypothesis chosen was two-sided hypothesis claim as shown in equation given below.
In order to perform these significance tests, EERs obtained for the static (population group μsitting) and dynamic scenarios (population group μwalking) were randomly chosen. For a given hypothesis test, ‘ α’ denotes significance level. For these tests, the α value was set as 0.05. A P value was calculated for individual statistical significance tests performed between different scenarios. As shown in Table 5, all calculated P values were below the significance level α; therefore, the null hypothesis was rejected. These results once again ascertain the hypothesis that there is a difference in performance of swipe gesture authentication for a static scenario versus dynamic scenarios.
4.3 Performance analysis for time-separated swipe gestures (inter-session analysis)
For this analysis, swipe gestures obtained on different days/sessions (separated by a week) but under the same usage scenario were compared. The user model was enrolled with swipe gestures taken from the static scenario of session 1 and verified against the static scenario of session 2. Similarly, the comparison was made for the walking scenario. As seen in Fig. 6, with ten swipe samples in enrolment, an EER of 44% was attained for horizontal swipes and 39% for vertical swipe for static scenario comparison. On the other hand, an EER of 32% for horizontal swipes and 16% for vertical swipes were attained for inter-session comparison for dynamic scenario (walking outdoors). This highlights that the EERs get considerably worse for inter-session comparisons, which raises questions about the stability of the swipes over time. Considering that same mobile device was used in both the sessions, there is merit in further investigating if this variability in the EERs could be associated with the users’ behaviour. From the data, we note that some users had large variance in feature set data acquired from session 1 and session 2 compared to others. Therefore, it is possible that the user behaviour for some users are fairly similar over time compared to others. This would need further research with a larger sample size and well defined used behaviour scenarios to ascertain impact of this factor.
4.4 Evaluation of consistent features across usage scenarios
We conducted this analysis to investigate how reliable the extracted features are across different usage scenarios of a mobile device. High consistency is the most desired characteristic of any feature. In order to carry out this analysis, a 28-parameter feature set, as shown in Table 2, was extracted from the genuine and the imposter (randomly chosen) users. The extracted features were first normalised for horizontal and vertical swipes and, then, min-max normalisation method (equation given below) was applied.
Lee et al. [20] defined a simple consistency measurement for a feature using a genuine class and a forgery class. A modified version of their consistency measurement (equation given below) has been used for calculating stability of every individual feature from the feature set. Since the aim of this experiment was to evaluate the consistency measure for a given genuine user across different scenarios, the forgery class was ignored. Instead, for a given user, the mean and sample variance acquired from a scenario (for example Sitting) was compared with other scenarios (for example Walking).
For a given feature i of a subject a, the distance (di(a)) of that feature for two usage scenarios was calculated by applying the above formula, by acquiring the sample mean(m(ascenario1/scenario2,i)) and sample covariance (σ2(ascenario1/scenario2,i)) of both the scenarios. If the distance calculated for feature i was greater than feature j, that is, di(a)>dj(a), feature i was considered to be more consistent. For each user, the feature consistency distance was calculated for every feature and an average of the distance for every feature was acquired. Based on above methodology, the results obtained for consistency measure for each feature for the horizontal and vertical swipes are provided in Fig. 7. Features maximum slope, mean velocity of second half of stroke, standard deviation, norm Y, peak velocity value, average finger size show more consistency than other features for all three scenarios—Sitting vs Treadmill, Sitting vs Walking and Treadmill vs Walking. These identified consistent features shall be further utilised to optimise the verification performance in the next verification model built using feed forward deep neural network architecture.

Consistency of horizontal and vertical swipe features
5 Discussion
Unlike traditional biometrics, mobile biometrics provide flexibility for the users to carry out authentication on device anywhere and everywhere, thereby also introducing additional challenges to address. One of the key challenges is to provide stable authentication across usage scenarios. The outcome of performance evaluations across usage scenarios reveal a significant difference in verification accuracy for a stationary scenario (seated on a chair) and scenarios with body movement. One possible reason for the variation in verification accuracy could be the selection of enrolment swipe samples. The enrolment swipes for all evaluations were taken from baseline scenario (sitting) and were captured under controlled settings. However, the verifications were done on swipe gesture samples that came from uncontrolled data captured using scenarios with or without body movement. Given promising verification rate of Sitting vs Sitting scenario, it is likely that the verification accuracy may improve if the enrolment and verification samples are always coming from same usage scenario. This suggests that there is a need to choose appropriate templates for swipes to improve verification accuracy. A template selection strategy to dynamically choose appropriate enrolment swipe gestures based on movement and non-movement scenarios needs to be developed. However, such a technique would mean that the enrolment process would require user to capture swipes for different scenarios thereby implying additional efforts from the user. Also, such a strategy would raise additional concerns such as validity of the enrolled swipes (do the enrolled swipes need replacement? If so, how frequently the enrolment swipes have to be replaced) and the extent of usage scenarios that needs to be defined.
For swipe gesture authentication, evaluating the verification persistence is another key challenge. The experimental results obtained for intra-session comparison (performed on the same day) are more acceptable than inter-session comparisons (performed on different days of a week). A possible reason could be that the user behaviour is more stable on the same day compared to over a whole week. Nonetheless, a significant difference in the verification performance for inter-session comparison raises questions about the longevity of this behavioural feature. Hence, the concept of ‘one time enrolment’ may have to be investigated for swipe-based authentication.
Another key aspect of swipe-based authentication is usability. From this perspective, the idea of attaining higher accuracy rates based on minimal data is highly attractive. The results of this analysis show that there is a need to have at least six swipes in enrolment. However, a standardised method to qualitatively select these enrolment swipe samples needs to be established. Considering that the swipe based authentication is silent and non-intrusive to the user, there is a need to identify if the enrolment data would consist of the first few swipes exhibited by the user or would be qualitatively selected from a sequence of swipes acquired over a period of time.
As efforts are being taken to use minimum number of swipes in enrolment, it is extremely important to use the most stable and discriminant features. As new features for swipe gesture based authentication are evolving, there is a growing need to optimise these features in order to have a positive impact on the verification accuracy. The analysis to find the consistent features reveals that features such as maximum slope and standard deviation are stable for both horizontal and vertical swipes across all usage scenarios, while number of data points and finger size are consistent for horizontal swipes, but not for vertical swipes.
One of the limitations of this study is that the analysis has been done on swipe data acquired only in portrait mode and using one device model (Samsung Galaxy Note 5). It would be interesting to conduct a similar analysis across multiple devices with different screen sizes which could highlight further challenges with regards to interoperability. Future work would include development of template update strategies, studying the impact of usage scenarios across multiple devices and orientation types (portrait and landscape) while using multiple fingers.
Another noteworthy aspect of study is that the EERs acquired for the dynamic scenarios using the state-of-the-art methods are not in an acceptable range to be adopted as a usable application. However, this work is only a proof-of-concept that demonstrates the impact of dynamic scenarios on the verification accuracy. Based on the results, we are concluding that the verification performance is negatively impacted by movement of either the subject or the environment (compared to static scenarios). Thus, to achieve an acceptable EER in dynamic scenarios, developing a multi-modality approach that combines data from other sensors on the mobile device, especially considering the walking scenarios, using the built-in accelerometer or gyroscope sensors could possibly improve the verification accuracy. Additionally, we would like to point out that these results have been achieved using only 50 users. Carrying out similar analysis with more data points and more number of users would further confirm the impact of usage scenarios on the verification performance.
6 Conclusion
Our analysis aimed at evaluating the swipe gesture authentication across various usage scenarios of a mobile device. The evaluation was performed on a touch-dynamics based dataset captured under four scenarios—the user seated on a chair, the user walking on a treadmill, the user walking outdoors and the user sitting on a bus. Three classification algorithms—SVM, kNN and naive Bayes—were used for the analysis. The intra-session evaluation results obtained using linear SVM classifier show an average EER of 1% for horizontal swipes and 2% for vertical swipes when the enrolment and verification swipes are from the static scenario (seated on a chair). However, the average EER for horizontal swipes grew significantly for other scenarios : 23% (treadmill, session 1), 31% (walking outdoors, session 1), 27% (walking outdoors, session 2) and 30%(bus, session 2). The rise in EER values for dynamic scenario were seen across all three classification algorithms. These results show the extent of impact of the usage scenarios on the verification accuracy. The results raise questions about the stability of swipe gesture authentication when used on a mobile device in real-life situation. Further, the inter-session and intra-session comparison results show that the swipe gestures acquired on the same day yield better EER compared to those acquired on different days. This opens up several challenges relating to time persistence of swipe-based authentication. Additionally, it is important to build authentication algorithms using the features that are most consistent across usage scenarios. Towards this, our analysis revealed that features such as standard deviation are stable for both horizontal and vertical swipes. Future work will focus on exploring neural network model such as RNN (recurrent neural network) to conduct this evaluation and develop methods to mitigate the influence of the usage scenarios on the verification performance such as template selection techniques.
Availability of data and materials
Biometric data is classified as personal under GDPR regulations, and as we do not have explicit authorisation from test participants to distribute samples, we are unable to make these data available to the research community.
Abbreviations
- SVM:
-
Support vector machine—a classification algorithm that distinctly classifies the data points by finding a hyperplane in an N-dimensional space (N—the number of features)
- kNN:
-
k-nearest neighbour algorithm—a non-parametric method used for classification
- UI:
-
User Interface—the user interface of a smart-phone
- FAR:
-
False acceptance rate—it is the measure of the likelihood that the biometric security system will incorrectly accept an access attempt by an unauthorised user
- FRR:
-
False rejection rate—it is the measure of the likelihood that the biometric security system will incorrectly reject an access attempt by an authorized user
- RBF:
-
Radial basis function—it is a kernel function used in various kernelised learning algorithms
- EER:
-
Equal error rate—it is used as the evaluation metric in biometrics; it is the value when the false acceptance rate and the false rejection rate are equal
References
R. B. Gonzalo, B. Corsetti, I. Goicoechea-Telleria, A. Husseis, J. Liu-Jimenez, R. Sanchez-Reillo, T. Eglitis, E. Ellavarason, R. Guest, C. Lunerti, M. Azimi, J. Khiarak, S. Ezennaya-Gomez, N. Whiskerd, R. Kuzu, E. Okoh, in 2018 International Carnahan Conference on Security Technology (ICCST). Attacking a smartphone biometric fingerprint system: a novice’s approach, (2018), pp. 1–5. https://doi.org/10.1109/CCST.2018.8585726.
K. Cao, A. K. Jain, Hacking mobile phones using 2d printed fingerprints. Technical Report (2016).
I. Goicoechea-Telleria, J. Liu-Jimenez, H. Quiros-Sandoval, R. Sanchez-Reillo, in 2017 International Carnahan Conference on Security Technology (ICCST). Analysis of the attack potential in low cost spoofing of fingerprints, (2017), pp. 1–6. https://doi.org/10.1109/CCST.2017.8167798.
S. Mondal, P. Bours, in 2015 International Conference on Biometrics (ICB). Swipe gesture based continuous authentication for mobile devices, (2015), pp. 458–465. https://doi.org/10.1109/ICB.2015.7139110.
T. Feng, J. Yang, Z. Yan, E. M. Tapia, W. Shi, in Proceedings of the 15th Workshop on Mobile Computing Systems and Applications. Tips: context-aware implicit user identification using touch screen in uncontrolled environments (ACM, 2014), p. 9.
M. Frank, R. Biedert, E. Ma, I. Martinovic, D. Song, Touchalytics: On the applicability of touchscreen input as a behavioral biometric for continuous authentication. IEEE Trans. Inf. Forensic Secur.8(1), 136–148 (2013). https://doi.org/10.1109/TIFS.2012.2225048.
C. Bo, L. Zhang, T. Jung, J. Han, X. Li, Y. Wang, in 2014 IEEE 33rd International Performance Computing and Communications Conference (IPCCC). Continuous user identification via touch and movement behavioral biometrics (IEEENew York, 2014), pp. 1–8. https://doi.org/10.1109/PCCC.2014.7017067. https://doi.org/10.1145/2592235.2592252.
P. Saravanan, S. Clarke, D. H. P. Chau, H. Zha, LatentGesture: Active User Authentication through Background Touch Analysis, (2014).
T. Feng, J. Yang, Z. Yan, E. M. Tapia, W. Shi, in Proceedings of the 15th Workshop on Mobile Computing Systems and Applications - HotMobile ’14. Tips: Context-aware implicit user identification using touch screen in uncontrolled environments (ACMNew York, 2014), pp. 9–196.
X. Wang, T. Yu, O. Mengshoel, P. Tague, in Proceedings of the 10th ACM Conference on Security and Privacy in Wireless and Mobile Networks - WiSec ’17. Towards continuous and passive authentication across mobile devices: an empirical study (ACMNew York, 2017), pp. 35–45.
M. D. Papamichail, K. C. Chatzidimitriou, T. Karanikiotis, N. -C. I. Oikonomou, A. L. Symeonidis, S. K. Saripalle, Behavioral biometrics dataset towards continuous implicit authentication (2019). https://doi.org/10.5281/zenodo.2598135.
J. Fierrez, A. Pozo, M. Martinez-Diaz, J. Galbally, A. Morales, Benchmarking touchscreen biometrics for mobile authentication. IEEE Trans. Inf. Forensic Secur.13:, 2720–2733 (2018).
U. Mahbub, S. Sarkar, V. M. Patel, R. Chellappa, in 2016 IEEE 8th International Conference on Biometrics Theory, Applications and Systems (BTAS). Active user authentication for smartphones: a challenge data set and benchmark results (IEEENew York, 2016), pp. 1–8.
A. Serwadda, V. V. Phoha, Z. Wang, in IEEE 6th International Conference on Biometrics: Theory, Applications and Systems, BTAS 2013. Which verifiers work?: A benchmark evaluation of touch-based authentication algorithms (IEEENew York, 2013).
M. Antal, Z. Bokor, L. Z. Szabó, Information revealed from scrolling interactions on mobile devices. Pattern Recogn. Lett.56:, 7–13 (2015).
E. Ellavarason, R. Guest, F. Deravi, in 2018 26th European Signal Processing Conference (EUSIPCO). A framework for assessing factors influencing user interaction for touch-based biometrics, (2018), pp. 553–557. https://doi.org/10.23919/EUSIPCO.2018.8553537.
C. Bo, L. Zhang, T. Jung, J. Han, X. -Y. Li, Y. Wang, in 2014 IEEE 33rd International Performance Computing and Communications Conference (IPCCC). Continuous user identification via touch and movement behavioral biometrics (IEEE, 2014), pp. 1–8.
X. Wang, T. Yu, O. Mengshoel, P. Tague, in Proceedings of the 10th ACM Conference on Security and Privacy in Wireless and Mobile Networks. Towards continuous and passive authentication across mobile devices: an empirical study (ACM, 2017), pp. 35–45.
I. Rish, et al, in IJCAI 2001 Workshop on Empirical Methods in Artificial Intelligence, 3. An empirical study of the naive Bayes classifier (IJCAI, 2001), pp. 41–46.
L. L. Lee, T. Berger, E. Aviczer, Reliable on-line human signature verification systems. IEEE Trans. Pattern Anal. Mach. Intell.6:, 643–647 (1996).
Funding
This work was supported by the EU Horizon 2020 Framework for Research and Innovation under Grant Agreement Number 675087 AMBER (enhAnced Mobile BiomEtRics) Marie Sklodowska-Curie consortium.
Author information
Authors and Affiliations
Contributions
EE and RG conceived of the presented idea. EE developed the theory and performed the experimentation and computations. RG and FD verified the analytical methods and supervised the findings of this work. All authors discussed the results and contributed to the final manuscript. The authors read and approved the final manuscript.
Corresponding author
Ethics declarations
Competing interests
The authors declare that they have no competing interests.
Additional information
Publisher’s Note
Springer Nature remains neutral with regard to jurisdictional claims in published maps and institutional affiliations.
Rights and permissions
Open Access This article is licensed under a Creative Commons Attribution 4.0 International License, which permits use, sharing, adaptation, distribution and reproduction in any medium or format, as long as you give appropriate credit to the original author(s) and the source, provide a link to the Creative Commons licence, and indicate if changes were made. The images or other third party material in this article are included in the article’s Creative Commons licence, unless indicated otherwise in a credit line to the material. If material is not included in the article’s Creative Commons licence and your intended use is not permitted by statutory regulation or exceeds the permitted use, you will need to obtain permission directly from the copyright holder. To view a copy of this licence, visit http://creativecommons.org/licenses/by/4.0/.
About this article

Cite this article
Ellavarason, E., Guest, R. & Deravi, F. Evaluation of stability of swipe gesture authentication across usage scenarios of mobile device. EURASIP J. on Info. Security 2020, 4 (2020). https://doi.org/10.1186/s13635-020-00103-0
Received:
Accepted:
Published:
DOI: https://doi.org/10.1186/s13635-020-00103-0