- Research
- Open access
- Published:
Detection of spoofed and non-spoofed DDoS attacks and discriminating them from flash crowds
EURASIP Journal on Information Security volume 2018, Article number: 9 (2018)
Abstract
Distributed computing technology is widely used by Internet-based business applications. Supply chain management (SCM), customer relationship management (CRM), e-Commerce, and banking are some of the applications employing distributed computing. These applications are the main target to massive attacks known as distributed denial-of-service (DDoS) that cause a denial of service or degradation of services being rendered. The servers that provide reliable services to genuine users in a distributed environment are victims of such attacks that flood fake requests that appear genuine. Flash crowd, on the other hand, is the huge amount of traffic caused by certain flash events (FEs) that mimics DDoS attacks. Detection of DDoS attacks in the wake of flash crowds is a challenging problem to be addressed. The existing solutions are generally meant for either flash crowds or DDoS attacks and more research is needed to have a comprehensive approach for catering to the needs of detection of spoofed and non-spoofed variants of DDoS attacks. This paper proposes a methodology that can detect aforementioned DDoS attacks and differentiate them from flash crowds. NS-2 simulations are carried out on Ubuntu platform for validating the effectiveness of the proposed methodology.
1 Introduction
The Internet has become a backbone of many distributed applications where the location of servers is not important from a user perspective. In the last decade, many servers in a distributed environment were subjected to a massive denial of service attack known as distributed denial-of-service (DDoS) attack. DDoS attacks occur when a large number of compromised systems flood requests to one or more web servers in the distributed environment. Flash crowd is another traffic scenario in a distributed environment that resembles DDoS traffic. However, a flash crowd is genuine traffic from legitimate systems but the traffic is more due to a flash event [1]. Both traffics appear the same except in the cases such as access intents, the speed of decreased or increased traffic, and distribution of source IP address. Access intent is different in these two as flash crowds are natural flows due to breaking news while the DDoS traffic is the result of a massive denial of service (DoS) attack. The distribution of source IP addresses in case of flash crowds is huge in number and is dispersive while the distribution of the source IP address with a real DDoS attack is limited to compromised nodes only. With respect to flash crowds, the increase or decrease in the speed of traffic is gradual as the spreading news is done slowly. On the other hand, DDoS attack causes heavy traffic that comes in bursts. The traffic increase is done in a short time.
Many researchers contributed towards detecting DDoS attacks and discriminating them from flash crowds. Entropy variations are used in [1] on Internet Threat Monitors (ITMs) for differentiating flash crowds and DDoS attacks. Time-varying traffic behavior of web proxies is explored in [2] where soft control which is a new attack response approach was introduced. Application-layer DDoS attacks were detected and prevented in [3] based on Real-time Frequency Vector (RFV). It was able to characterize the traffic in real time and made some models for effectiveness. These models are based on the entropy of traffic which is somewhat similar to that of [1]. Artificial Neural Network (ANN) is used in [4] for studying patterns and detecting DDoS attacks from genuine traffic. Partial rank correlation (PRC) technique is employed in [5] for detecting low-rate and high-rate DDoS attacks. It uses rank value for detecting malicious traffic from genuine traffic with high detection accuracy. But it does not focus on the extreme deviations from the median of probability distributions. A filtering-based approach is explored in [6] where routers do perform filtering of unwanted traffic with the notion of filter propagation. Filtering makes use of hot count, router’s resource availability, and router’s link degree. It does mean that a router which is close to attackers do have more resources and exhibit more connections with neighbors. Since filters work in collaboration with each other in a distributed environment, this method exhibits higher attack blocking ratio. At the same time, it also causes issues when there is a problem with filtering criteria.
Other approaches found in the literature include a method to survive organized DDoS attacks that resemble flash crowd (FC) [7, 8], observations on packet arrival patterns [9], entropy-based methods [10], entropy variations [11], traffic cluster entropy-based approach [12], generating traffic for FE and DDoS [13], human behavior during FE [14], connected vehicle technology for mitigating effect of FC [15], and a comprehensive approach for discriminating between flash crowds and DDoS attacks. Out of which, many used entropy-based methods. Each method has its own merits and demerits. There is need for a comprehensive detection and discrimination approach.
To overcome issues with different kinds of approaches, in this paper, we proposed a comprehensive methodology that considers multiple dynamics of traffic including source entropy, traffic entropy, and different thresholds for good understanding and detection of DDoS attacks such as spoofed and non-spoofed DDoS attacks. Spoofed DDoS attacks are the attacks in which IP address in packets is spoofed while this does not happen in case of non-spoofed DDoS attacks. The methodology also discriminates them from flash crowds. Detection rate, false positive rate, and classification rate are used to evaluate the efficiency of the proposed methodology. Network simulation test bed NS2 is used to demonstrate proof of the concept. The remainder of the paper is structured as follows. Section 2 reviews literature related to DDoS attacks and flash crowds in terms of detection and prevention methods. Section 3 provides preliminaries to understand the proposed system. Section 4 explains the proposed methodology for detection of spoofed and non-spoofed DDoS attacks and discriminating them from flash events. Section 5 presents experimental results and evaluation while Section 6 concludes the paper besides providing a future scope of the research.
2 Related works
In the wake of increased DDoS attack threats over the Internet, Rai et al. [16] studied the problem of unavailability of web sites and degraded network performance. They made a survey of different DDoS mitigation techniques that came into existence. They include volume-based attacks such as Transmission Control Protocol (TCP) SYN flood, application DDoS attacks such as HTTP-GET flood, and low-rate attacks such as slowloris attack. Another good survey of DDoS attacks is made by Zargar et al. [17] with respect to flooding. Prasad et al. [1] employed different entropy variations on Internet Threat Monitors (ITMs) for characterizing DDoS attacks and discriminate them from that of flash crowds. They formulated the problem using botnets and proposed a discrimination approach. A large number of compromised machines that participate in DDoS attack formed a botnet.
Jaideep et al. [18] have made a survey on P2P networks and mentioned DDoS attacks on such networks besides countermeasures to those attacks. Tang et al. [2] proposed a server side defense mechanism for withstanding DDoS attacks that are web proxy-based. Since it employs both spatial and temporal locality to extract features from proxy server traffic, it does not directly depend on traffic intensity. Weak signals are protected from interference caused by large values that occur infrequently by using nonlinear mapping function. To model the time-varying behavior of proxy in terms of traffic, a hidden semi-Markov model is used to uncover hidden states and provide an effective solution. The attack response system was named as soft control which converts suspicious traffic into some sort of normal traffic. Thus, it can protect the interests of legitimate users. This method also proved to be effective in early detection. Zhou et al. [3] studied DDoS attacks and their characteristics when they occur in backbone web traffic in the application layer of OSI reference model. They proposed a defense architecture and integrated it with a detection algorithm. They built the architecture in such a way that it could be deployed in backbone networks. They applied the algorithm to real traffic generated from Sina and Taobao to demonstrate proof of the concept. Their method was effective in defining application-layer DDoS attacks. They could find out the malicious sources but could not improve reaction rate. Bhuyan et al. [19] employed information metrics for detection of two kinds of DDoS attacks namely high-rate DDoS and low-rate DDoS. Information metrics they used are Kullback-Leiber divergence, generalized entropy, Renyi’s entropy, Shannon entropy, and Hartley entropy. The advantage of their method is low computational complexity. However, it was not able to overcome the early detection problem.
Sachdeva et al. [20] employed optimal thresholds for traffic cluster entropy and utilized receiver operating characteristic curve (ROC), detection rates and false positive rates for evaluating their method. Their method was meant for discriminating DDoS attack from flash events. They used NS2 simulations for their study. They left the real implementation of the mechanism for future. ANN is used by Saied et al. [4] for detection of already known and unknown attacks pertaining to DDoS. Their solution was based on certain patterns. Their solution could not handle DDoS attacks where packet headers are encrypted. Little et al. [21] proposed a technique known as spectral clustering for classifying various network attacks including DDoS attacks. They evaluated the accuracy of classification, and the classifier cloud be used to have real-time attack detection. They suggested the use of spectral clustering technique for real-time intrusion detection in future. Noor et al. [22] focused on software-defined networking (SDN) for detection and mitigation of domain name system (DNS) amplification attack. It is a kind of DDoS attack that performs attacks on domain name service (DNS) servers and causes amplified responses. Service function chaining is the improvement they deferred for future work. Divakaran et al. [23] studied the issues related to forensics and network security. They proposed an evidence gathering framework for discovering hidden patterns and correlating them for an increase in the capability of detection. They could differentiate normal traffic from that of malwares. They did not focus on evidences at different stages and work with live real-time traffic. Bhuyan et al. [5] proposed a method known as Partial Rank Correlation-based Detection (PRCD) for detecting and differentiating high-rate and low-rate DDoS attacks. They intended to use extreme value theory for detection of DDoS attacks. Fernandes et al. [24] proposed a statistical method based on flow analysis and principal component analysis (PCA) for anomaly detection. Thus, they could create a network profile named Digital Signature of Network Segment using Flow Analysis (DSNSF) which is used to predict the behavior of the network. This digital network is effectively used to form a threshold for anomaly detection. Seo et al. [6] proposed a novel solution to detect DDoS attack namely Adaptive Probabilistic Filter Scheduling (APFS). It exploits probability factors such as hop count from the sender, resource availability of filter router, and link degree of filter router. When compared to other filter-based mechanisms, it is found that APFS has 44% higher defense effectiveness. Xu et al. [25] proposed a method for detection of DDoS attacks based on a model which throws light into user clicks identification based on a Markov model known as hidden semi-Markov. Especially, it makes use of data pre-processing for effectively detecting application-layer DDoS attacks. However, it is to be evaluated. Xie et al. [26] proposed a based on web proxy-based server side defense mechanism with spatial locality and temporal behavior and soft control attack response method.
The DDoS attacks mentioned so far are made in distributed environments. Sahi et al. [27] proposed TCP flood kind of DDoS attack detection and prevention in a distributed and cloud computing environment. It was a classifier system named CS_DDoS employed for public clouds. They used k-fold cross validation model for evaluating the accuracy of their system. They tested their system with attacks from a single source and multiple sources. However, their system could not work for spoofed DDoS attacks. Stephanakis et al. [28] exploited the good features of self-organizing feature map (SOFM) for anomaly detection in cloud computing environments.
Different methods identified in the literature include entropy variations on ITMs, temporal and spatial locality behavior, real-time frequency vector-based approach, information metric approach, traffic cluster entropy, ANN, spectral clustering technique, DDoS TCP flood attack detection, sFlow with security-centric SDN, evidence gathering approach, partial rank correlation, self-organizing feature map, anonymous profile-based anomaly detection, adaptive probabilistic filter scheduling, user clicks identification, and proxy-based temporal and spatial locality behavior models. From the review of the literature, we found that most of the existing methods follow certain technique for DDoS attack detection which could be improved further with synergic effect by combining with other methods. In this paper, we proposed a hybrid approach for comprehensive understanding and differentiation between DDoS attacks and flash crowds.
3 Proposed system
The proposed system is based on an anomaly of traffic patterns. It is meant for detecting DDoS attacks and differentiating them from flash events. Packets in the traffic are observed. Each packet in the traffic when studied independently appears to be genuine. However, when packets at different places are correlated, it is possible to find the difference. Since DDoS attacks are man-made, the packets reflect some kind of patterns. The packets of DDoS violate normal and general structure and order of packets that are produced in genuine environments. The degree of disorder or randomness in network traffic flows is known as entropy. The entropy can be used to find source IP distribution. Figure 1 shows the overview of the proposed approach. It is able to classify the traffic into different kinds of DDoS attacks or flash events.

Overview of the proposed approach using source entropy and traffic entropy is considered for analysis and classification of DDoS attacks into spoofed and non-spoofed attacks besides flash events
When a DDoS attack is launched, the network status changes gradually and temporally. At a given time t1, it is assumed that the general state of the network shows reasonably less traffic. However, if the traffic is very high, then it indicates that DDoS attack is started. As time goes on, it may increase to the level of traffic where detection becomes apparent. This point is denoted as t2. The point made here is that there is some time interval between t2 and t1 which is nothing but detection delay. Source entropy is the number of source IP addresses from which attack is launched. The traffic that comes from the same network is considered traffic cluster. Entropy pertaining to traffic cluster is known as traffic entropy. Generally, an analysis is the process of analyzing server load characteristics and features of network traffic. The former includes memory utilization, CPU load, user level utilization of CPU, and system level utilization of CPU. The latter includes traffic distribution, a number of source IP addresses, newly found source IP addresses, and incoming traffic volume. As this kind of analysis incurs computational complexity, the notion of traffic cluster with respect to traffic entropy is used. Thresholds are derived from traffic entropy in order to minimize false positives and increase the rate of detection.
At the starting of simulation first, we find out initial source entropy and traffic entropy. We start to send packets. It may be either attacker, legitimate user, or may be a normal user. We find out time where the traffic is continuously increased. At that time we find current source entropy and traffic entropy and also find out source deviation and traffic deviation, according to the conditions, we can tell if it is DDOS, spoofed DDoS, sophisticated DDoS, flash event, or high-volume DDoS. There are various notations used in the proposed approach as presented in Table 1. Source IP address is a 4-byte logical address used in the packets to represent its source IP. Traffic cluster is denoted as t. Source address entropy is denoted as H(). Let the random variable H() take the values 1, 2, 3, 1 in different packets.
Let the number of packets received per Sc_IP be.
H(Sc_IP) = −\( \sum \limits_{i=1}^Np\left( Sc\_{IP}_i\right){\mathit{\log}}_2\left( Sc\_{IP}_i\right). \)
p (Sc_I={p(Sc_IP1) p(Sc_IP2).............p(p(Sc_IPn)
p\( \left( Sc\_ IP\right)=\frac{X_i}{S} \) where S=\( \sum \limits_{i=1}^n{X}_i \)
Similarly, traffic entropy is defined as
H(t_ID) = −\( \sum \limits_{i=1}^Mp\left(t\_{ID}_i\right)\mathit{\log}2p\Big(\left( tc\_{ID}_i\right) \)
p(t_ID) = p(t_ID1) p(t_ID2) .......p(t_IDn)
p(t_ID)=\( \frac{Y_i}{S} \) S=\( \sum \limits_{i=1}^n{Y}_i \)
3.1 Flash event condition
(Hc(Sc_IP)) > (HN(Sc_IP) + u*σSc_IP))
[Current source entropy>upper threshold source entropy]
(Hc(t_ID) < (HN(tID) − v∗σt_ID))
[Current traffic entropy<lower threshold traffic entropy]
According to the flash event conditions given above, if the current source entropy is greater than the upper threshold source entropy and the current traffic entropy is less than the lower threshold traffic entropy, it is considered as a flash and event and not a DDoS attack. Thus, it is able to distinguish flash event from spoofed and non-spoofed attacks.
3.2 Spoofed DDoS attack condition
(Hc(Sc_IP)) > (HN(Sc_IP) + u*σSc_IP))
[Current source entropy>upper threshold source entropy]
(Hc(t_ID) > (HN(tID) − v∗σt_ID))
[Current traffic entropy>lower threshold traffic entropy]
As per the spoofed DDoS attack conditions given above, if the current source entropy is greater than the upper threshold source entropy and the current traffic entropy is greater than the lower threshold traffic entropy, then it is considered as spoofed DDoS attack.
3.3 Non-spoofed DDoS attack condition
(Hc(scIP)) > (HN(scIP) − u∗σsc_IP)
[Current source entropy<lower threshold source entropy]
(Hc(t_ID)>(HN(tc_ID)+v∗σtc_ID))
[Current traffic entropy>upper threshold traffic entropy]
As per the non-spoofed DDoS attack conditions given above, if the current source entropy is less than the lower threshold source entropy and the current traffic entropy is greater than the upper threshold traffic entropy, such attack is considered to be non-spoofed DDoS attack.
3.4 Standard deviation
Standard deviation is a measure of the dispersion of a set of data from its mean. It is calculated as the square root of variance by determining the variation between each data point relative to the mean.
It can be calculated using σ=\( \sqrt{\frac{\sum {\left(x-\overline{x}\right)}^2}{N}} \)
where x refers to the packet value in the network. The mean of packet values is denoted as x̄. The number of packets is denoted as N. The mean average of packet values is computed as \( \overline{x}=\sum \frac{x}{N} \).
4 Experimental design
We considered transit-stub which model hierarchical nature of the Internet. The rationale behind this is that the DDoS attacks occur in a distributed environment where multiple nodes are compromised by adversaries before launching a massive denial of service (DoS) attack. In the chosen network, many domains exist. Each domain is either a transit or stub network. The end hosts to the Internet are connected by the stub network. Many stub networks are interconnected by transit networks. The nodes that generate traffic are connected to stub networks. Attack users and genuine users are connected to stub networks. The aim of the experiments is to secure and protect a server which is victimized via DDoS attacks. The simulation topology is based on GT-ITM which has as many as 8 ISP domains with 12 transit routers to which FE, DDoS, and legitimate nodes are connected. In an ISP domain, the DDoS attack is detected. Figure 2 shows the outline of the topology. In Fig. 2, transit network for connecting two or more stub networks, legitimate clients, and attacker nodes are connected to the stub network. The aim of the proposed approach is to protect the victim server from DDoS attacks.

Overview of the topology in transit network for connecting two or more stub networks. Transit network is nothing but a regional Internet service provider (ISP) or backbone ISP
For each kind of traffic generation such as legitimate traffic, attack traffic, and flash events, around 400 nodes are used. The simulation environment is created with NS2. The simulation lasts for 70 s. The three kinds of traffic start randomly with a certain interval. Legitimate web traffic is generated by using HTTP (HyperText Transfer Protocol (HTTP). User Datagram Protocol (UDP) is used to generate attack traffic. The attacker nodes do modify TCP protocols in order for successful DDoS attacks. They send a huge amount of traffic in such a way that HTTP servers are overwhelmed with attack traffic. Constant bitrate (CBR) mode in NS2 is used to have UDP flows. With respect to attack parameters, the size of the time window is made adjustable.
Traffic cluster entropy for different window sizes are computed. Based on the server processing capacity classification rate, detection rate, false negative rate, and false positive rate are considered. Typical attack period considered is 30–35 s. Start time for flash traffic is 25–30 s, and finish time is 45–50 s. Legitimate traffic start time is set randomly between 1 and 20 s, and end time is set at 70 s.
5 Results and discussion
Experiments are made with the simulation and experiment design discussed in the previous section. Detection metric is made up of traffic cluster entropy and source address entropy with logical OR/AND. Many observations are made in the experiments. When FE and DDoS attacks are made at a time, source address entropy is increased. In case of only DDoS attacks, the other entropy named traffic cluster entropy is increased. Therefore, it is understood the traffic cluster entropy is the major part of detection metric which serves two purposes such as detecting a DDoS attack and also discriminating the same from FE. Thresholds for source address entropy are taken as per six sigma method while the same for traffic cluster entropy is obtained using ROC curve. Different simulations are carried out for evaluating the proposed methodology. Normal web traffic scenario is used to have baseline scenario. Source IP address entropy, its standard deviation with respect to traffic cluster entropy are computed without attack. The experimental results are compared with the work influenced by [20] which is our prior work. The existing system is our own simulation whose results are compared with the proposed system.
As shown in Fig. 3, detection delay is computed as td−ta. At ta, it is assumed that the network is under a heavy load reflecting an unusual event. It does mean that really attacking sources are causing that load or the load is caused by a legitimate flash event. It is evident that the attack start time and detection time are able to provide the delay in detection of an attack. Considering DDoS attack start time and as attack detected time, the detection delay is computed as follows.
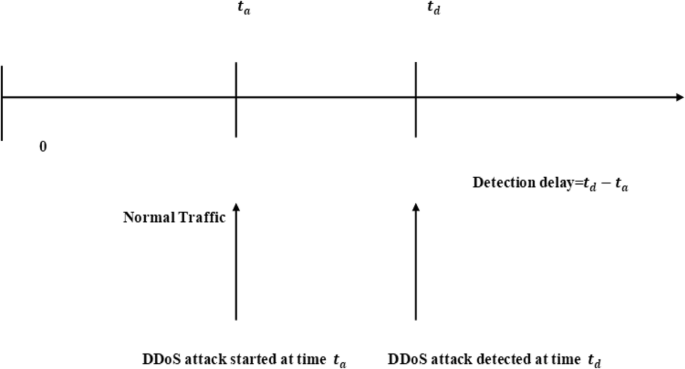
Timeline showing attack start time, attack detected time, and the delay. It shows network state. At the time ta, DDoS is started and at the time td, the attack is detected
Detection delay=td − ta.
There are two variables known as tolerance factors denoted as u and v ∈I where I is the set of integers. Tolerance factors are the design parameters. The attack detection parameters are described here. Time window is set to 0.6 s. Tolerance factor u is set to 6 which is in accordance with Six Sigma method. The tunable tolerance factor v is considered for different modes of operation. For best detection rate, the v values are 3 and 4. For normal defense, they are 5 and 6. For best false positive rate, they are 7, 8, 9, 10, and 11. As different networks do have requirements differently, the tunable parameters help in considering different network conditions. Tolerance factor is the amount of deviation which is considered appropriate to raise DDoS attack alarm. Based on this, best detection rate, best false positive rate, and normal detection are described here. For best detection rate to be achieved, tolerance factor is set to a low value. It does mean that the range given for normal traffic cluster entropy is less. This will ensure reduction of false negatives and improve detection rate. It can detect all attacks accurately but may consider some normal states as attack states. The best false positive rate is achieved by setting tolerance factor to a high value. In this case, the range used for entropy for classification is broad and thus shows less detection rate and less false alarm rate. When false positive detection increases, attack detection decreases. For normal detection scenario, the threshold value for tolerance factor is set to medium. It balances false negatives and false positives. Experiments are made by changing tolerance factor between 1 and 10. Experiments are made with normal web traffic with DDoS attacks and normal web traffic with FE.
Detection rate is computed as a fraction of attack class that is detected correctly. It is computed as follows.
DR=\( \frac{TP}{TP+ FN} \)
The false positive rate is used to measure the ratio between a total number of normal traffic events and number of normal traffic events that are detected as attacks. It is computed as follows.
FPR=\( \frac{FP}{TN+ FP} \)
The classification rate is used to measure the ratio between a total number of actually occurred events and true classified events. It is computed as follows.
CR=\( \frac{TP+ TN}{TP+ TN+ FP+ FN} \)
Detection rate, classification rate, and false positive rate dynamics are presented and discussed in this section.
As shown in Table 2, it is evident that the false positive rate has its influence on the detection rate. The detection rate is increased as the false positive rate is increased. As the tolerance factor is changed, the false positive rate is also changed accordingly. It has influenced the detection rate of the system. The proposed detection rate at tolerance factor 10 is 0.42 while the existing detection rate is 0.33. When the tolerance factor is 1, the false positive rate is 0.4 while the detection rate of proposed and existing is 1 and 0.96, respectively.
There is a trade-off between detection rate and false positive rate. An increase in false positive rate is increasing detection rate. Therefore, false positive rate is used to measure the effectiveness of the system. As presented in Fig. 4, the detection rate for the given false positive rates is provided for both existing and proposed approaches. The proposed system shows better performance than existing one. Two trends are clearly visible in the results: detection rate is influenced by false positive rate, and the proposed system has comparable improvement in the detection rate consistently. Here, the existing approach is our prior work which was influenced by [20].

Detection rate vs. false positive rate. False positive rate and detection rate are plotted. The relationship between the false positive rate and detection rate are presented
The difference in the temporal variation of source address entropy and traffic entropy provide useful insights. As shown in Table 3, the temporal variation in entropy during normal web traffic with FE reveals entropy variations in source address entropy and traffic cluster entropy. The simulation time has an influence on the source address entropy while traffic cluster entropy remains constant after some initial simulation time.
As can be seen in Fig. 5, it is evident that the difference between existing and proposed systems is presented in terms of temporal variation in entropy during normal web traffic with a flash event. The temporal variation in entropy is visible at different simulation times. The traffic address entropy and source address entropy values are less than that of existing ones.

Temporal variation in entropy during normal web traffic with FE. Source address entropy and traffic address entropy are presented. The observations are made during a flash event
There is a difference between the existing and proposed systems in terms of pattern in which the traffic address entropy and source address entropy are revealed.
As shown in Table 4, the simulation time has its impact on the entropy with respect to variations in entropy during normal web traffic. The simulation time considered is from 0.6 s to 51.6 s with many intervals at which the entropy results are observed. The traffic entropy and source address entropy of an existing approach and the traffic entropy and source address entropy of the proposed system are presented. As the simulation time is increased, the entropy results are observed and presented.
As shown in Fig. 6, the variation in entropy during normal and web traffic is presented for both existing and proposed systems. The results reveal the details of both traffic entropy and source address entropy.

Variation in entropy during normal web traffic. Variation is found between source address entropy and traffic entropy
The entropy results observed at different simulation intervals showed the trends in the entropy values for both existing and proposed approaches. Since the proposed approach used different parameters for controlled experiments, the results revealed the difference in entropy dynamics. The variations in the entropy of existing and proposed systems provide useful insights.
Entropy values during normal web traffic with spoofed DDoS are presented in Table 5. The results reveal that there is more variation in this case between source address entropy and traffic cluster entropy. The results are observed with respect to spoofed DDoS attack detection. Measures such as traffic entropy and source address entropy for both existing and proposed approaches show the trends in the entropy values as the simulation progresses. Observations contain the entropy values at simulation times from 0.6 s to the end of simulation at 51.6 s.
As presented in Fig. 7, the results show the entropy dynamics during normal web traffic with spoofed DDoS. The results reveal the difference between source address entropy and traffic entropy for both existing and proposed systems. The entropy values presented are when spoofed DDoS attack is simulated. The proposed traffic entropy and the proposed source address entropy are lower than that of the existing one. The results show the traffic dynamics as the simulation time increases. The variations provide useful insights.

Entropy during normal web traffic with Spoofed DDoS attacks the source address and traffic address entropy are observed and presented
As shown in Table 6, it is evident that there is much different in source address entropy and traffic cluster entropy due to the reason that the variation entropy is recorded with normal web traffic with a non-spoofed DDoS attack. In the experiments where a non-spoofed DDoS attack is simulated, the entropy values such as traffic entropy and source address entropy are recorded for existing and proposed systems. When simulation time is 61.8, the traffic entropy and source address entropy of existing system are 5.3 and 8.56, respectively. The same for the proposed systems which are 4.5 and 7.23, respectively. There is a reduction in the entropy values showing the improvement in the performance.
As shown in Fig. 8, it is evident that the difference in source address entropy and traffic entropy of an existing and proposed system is visualized. The results reveal the dynamics of variation in entropy during normal web traffic with non-spoofed DDoS attacks. The entropy values are increased when simulation time is increased to some extent. Later on, there is a slight difference in the entropy values. However, the proposed system entropy values are less than that of the existing one. Based on the entropy values, the performance between the two approaches is changed. As shown in Fig. 4, the proposed system shows better performance in terms of detection rate.

Entropy variation between traffic address entropy and source address entropy are presented during web traffic reflecting the non-spoofed DDoS attack
6 Conclusions
In this paper, we proposed a methodology to detect spoofed and non-spoofed DDoS attacks and discriminate them from flash events. We employed source address entropy and traffic cluster entropy values in order to have accurate detection of the attacks. The proposed model has mechanisms for DDoS and FE scenarios in a more realistic distributed environment. Detection rate and false positive rate are used to analyze the performance of the proposed system. These attacks are also discriminated from flash events. Extensive simulations are made using NS2. The results revealed that the proposed method is capable of detecting aforementioned DDoS attacks and discriminate from flash events. In future, we implement the proposed method in real traffic to evaluate true performance of the proposed system. Improving mechanism for identifying low flash crowd attacks with high accuracy is another direction for future work. DDoS attacks may be encrypted by adversaries. Detecting such attacks is another promising direction for future work. Extreme value theory and its application for detecting DDoS attacks is yet another direction for future work.
References
Prasad, KM, Reddy, ARM, Rao, KV. (2010). Discriminating DDoS attack traffic from flash crowds on Internet Threat Monitors (ITM) using entropy variations. IEEE., 6, 1–10.
Yi, X, Tang, S, Xiang, Y, Hu, J. (2011). Resisting web proxy-based HTTP attacks by temporal and spatial locality behavior. IEEE., 6, 1–11.
Zhoua, W, Jia, W, Wenc, S, Xiang, Y, Zhouc, W. (2014). Detection and defense of application-layer DDoS attacks in backbone web traffic. Futur. Gener. Comput. Syst., 38(2014), 36–46.
Saied, A, Overill, RE, Radzik, T. (2016). Detection of known and unknown DDoS attacks using Artificial Neural Networks. Neurocomputing, 172, 385–393 Elsevier.
Bhuyan, MH, Kalwar, A, Bhattacharyya, DK, Kalita, JK (2015). Low-rate and High-rate Distributed DoS Attack Detection Using Partial Rank Correlation. In 5th International Conference on Communication Systems ans Network Technologies, (pp. 1–5).
Seo, D, Lee, H, Perrig, A. (2013). APFS: Adaptive Probabilistic Filter Scheduling against distributed denial-of-service attacks. Comput. Secur., 39(part B), 366–385 Elsevier.
Kandula, S, Katabi, D, Jacob, M, Berger, A (2012). Botz4Sale: Surviving Organized DDoS Attacks That Mimic Flash Crowds. In USENIX Association, NSDI ’05: 2nd Symposium on Networked Systems Design & Implementation, (pp. 287–300).
Bhatia, S (2013). Detecting distributed denial-of-service attacks and flash events, (pp. 1–238).
Thapngam, T, Shui, Y, Zhou, W, Beliakov, G (2012). Discriminating DDoS attack traffic from flash crowd through packet arrival patterns, (pp. 969–974).
Mahajan, D, & Sachdeva, M (2013). Distinguishing DDoS Attack and Flash Event using Real- World Datasets with Entropy as an Evaluation Metric. In 2013 International Conference on Machine Intelligence and Research Advancement, (pp. 90–94). IEEE.
Prasad, KM, Reddy, ARM, Rao, KV. (2013). Discriminating DDoS attack traffic from flash crowds on Internet Threat Monitors (ITM) using entropy variations. IEEE., 6(2), 53–62.
Sachdeva, M, & Kumar, K. (2014). A Traffic Cluster Entropy Based Approach to Distinguish DDoS Attacks from Flash Event Using DETER Testbed. ISRN Commun. Netw., 1–16.
Bhatia, S, Schmidt, D, Mohay, G, Tickle, A. (2014). A framework for generating realistic traffic for distributed denial-of-service attacks and flash events. Science Direct., 40, 95–107.
Pan, J, Hua, H, Liu, Y. (2014). Human behavior during flash crowd in web surfing. Physica A., 413, 212–219.
Grzybek, A, Seredynski, M, Danoy, G, Bouvry, P. (2015). Mitigating Flash Crowd Effect Using Connected Vehicle Technology. Veh. Commun., 2(4), 238–250 Elsevier.
Rai, A, & Challa, RK (2016). Survey on Recent DDoS Mitigation Techniques and Comparative Analysis. In IEEE Xplore, Second International Conference on Computational Intelligence & Communication Technology (CICT), (pp. 1–7).
Zargar, ST, Joshi, J, Tipper, D. (2013). A Survey of Defense Mechanisms Against Distributed Denial of Service (DDoS) Flooding Attacks. IEEE Commun. Surv. Tutorials, 15(4), 2046–2069.
Jaideep, G, & Battula, BP. (2016). Survey on the present state-of-the-art of P2P networks, their security issues and counter measures. Int. J. Appl. Eng. Res., 11(1), 616–620 ISSN 0973–4562.
Bhuyana, MH, Bhattacharyyab, DK, Kalitac, JK. (2015). An empirical evaluation of information metrics for low-rate and high-rate DDoS attack detection. Pattern Recogn. Lett., 51(c), 1–7.
Sachdeva a, M, Kumar, K, Singh, G. (2016). A comprehensive approach to discriminate DDoS attacks from flash events. J. Inf. Secur. Appl., 26, 8–22.
Little, A, Mountrouidou, X, Moseley, D (2016). Spectral Clustering Technique for Classifying Network Attacks. In IEEE Xplore, IEEE 2nd International Conference on Big Data Security on Cloud (BigDataSecurity), IEEE International Conference on High Performance and Smart Computing (HPSC), and IEEE International Conference on Intelligent Data and Security(IDS), (pp. 406–411).
Aizuddin, AA, Norulazmi, M, Akimi, S (2017). DNS Amplification Attack Detection And Mitigation Via sflow With Security-Centric SDN, (vol. Article.3, pp. 1–8). ACM DL, IMCOM’17.
Divakaran, DM, Fok, KW, Nevat, I, Thing, VLL. (2017). Evidence Gathering For Network Security And Forensics. Digit. Investig., 20, 56–65 Elsevier.
Fernandes Jr, G, Rodriguesa, JJPC, Proenc Jr, ML. (2015). Autonomous Profile-Based Anomaly Detection System Using Principal Component Analysis And Flow Analysis. Appl. Soft Comput., 34, 513–525 Elsevier.
Xua, C, Dua, C, Zhao, GF, Yub, S. (2013). A novel model for user clicks identification based on hidden semi-Markov. J. Netw. Comput. Appl., 36(2), 791–798 Elsevier.
Xie, Y, Tang, S, Xiang, Y, Hu, J. (2013). Resisting Web Proxy-based HTTP Attacks by Temporal and Spatial Locality Behavior. IEEE Trans. Parallel Distrib. Syst., 24(7), 1401–1410 Elsevier.
Sahi, A, Lai, D, Li, Y, Diykh, M. (2017). An Efficient DDoS TCP Flood Attack Detection and Prevention System in a Cloud Environment. IEEE Access, 5, 6036–6048.
Stephanakis, IM, Chochliouros, IP, Sfakianakis, E (2015). Anomaly Detection In Secure Cloud Environments Using a Self-Organizing Feature Map (SOFM) Model For Clustering Sets of R-Ordered Vector-Structured Features. In EANN2015 2nd Workshop on Innovative European Policies and Applied Measures for Developing Smart Cities, (pp. 1–9).
Acknowledgements
The authors would like to thank the editor and anonymous reviewers for their valuable suggestions that significantly improved the quality of this paper.
Availability of data and materials
Details related to data and simulation results are provided in the manuscript. They are not stored in any publicly available repositories.
Author information
Authors and Affiliations
Contributions
JG contributed in the methodology and implementation of the simulation study. BPB helped in the preparation of data and execution of simulations and observations. Both authors read and approved the final manuscript.
Corresponding author
Ethics declarations
Competing interests
The authors declare that they have no competing interests.
Publisher’s Note
Springer Nature remains neutral with regard to jurisdictional claims in published maps and institutional affiliations.
Rights and permissions
Open Access This article is distributed under the terms of the Creative Commons Attribution 4.0 International License (http://creativecommons.org/licenses/by/4.0/), which permits unrestricted use, distribution, and reproduction in any medium, provided you give appropriate credit to the original author(s) and the source, provide a link to the Creative Commons license, and indicate if changes were made.
About this article

Cite this article
Gera, J., Battula, B.P. Detection of spoofed and non-spoofed DDoS attacks and discriminating them from flash crowds. EURASIP J. on Info. Security 2018, 9 (2018). https://doi.org/10.1186/s13635-018-0079-6
Received:
Accepted:
Published:
DOI: https://doi.org/10.1186/s13635-018-0079-6